Beyond Pageviews: What Website Analytics Really Tells You
Beyond Pageviews: What Website Analytics Really Tells You
Your Website Has Traffic. But What Are Visitors Actually Doing?
Have you ever opened Google Analytics, reviewed your website traffic, and wondered what those numbers actually mean for your business?
Imagine discovering that your website attracted 2,000 visitors last month. That’s encouraging, right?
But what if most visitors never reach your services pages? What if people click your contact button but never complete the form? What if a blog post attracts hundreds of visitors but generates little interest in your services?
Suddenly, those 2,000 visitors don’t tell the whole story.
The real value of website analytics isn’t simply knowing how many people visited. It’s understanding what happened during those visits and identifying opportunities to improve their experience.
1. A Pageview Isn’t a Handshake
Getting someone to visit your website is an accomplishment. But attracting visitors and creating meaningful customer engagement are two different things.
A pageview tells you that a page was viewed. It doesn’t tell you whether someone found the information useful, understood your services, or decided to contact your business.
Consider two hypothetical websites:
- Website A: 5,000 visits and 10 qualified inquiries.
- Website B: 1,500 visits and 35 qualified inquiries.
Website A attracts significantly more traffic, but Website B generates more business opportunities from fewer visits.
That doesn’t automatically make Website B the better website. Different audiences, business goals, and customer journeys influence performance.
However, it demonstrates why traffic volume alone is not enough to measure success.
Businesses should also evaluate engagement, meaningful interactions, and conversions to understand whether their website supports customer needs.
The important question isn’t simply how many people visited. It’s whether visitors accomplished something meaningful.
2. Follow the Clicks, Not Just the Crowd
Website navigation is designed to help visitors find information, but customers don’t always follow the journey businesses anticipate.
Some arrive directly on a service page through Google Search. Others discover a blog article, explore a portfolio, or compare several services before making contact.
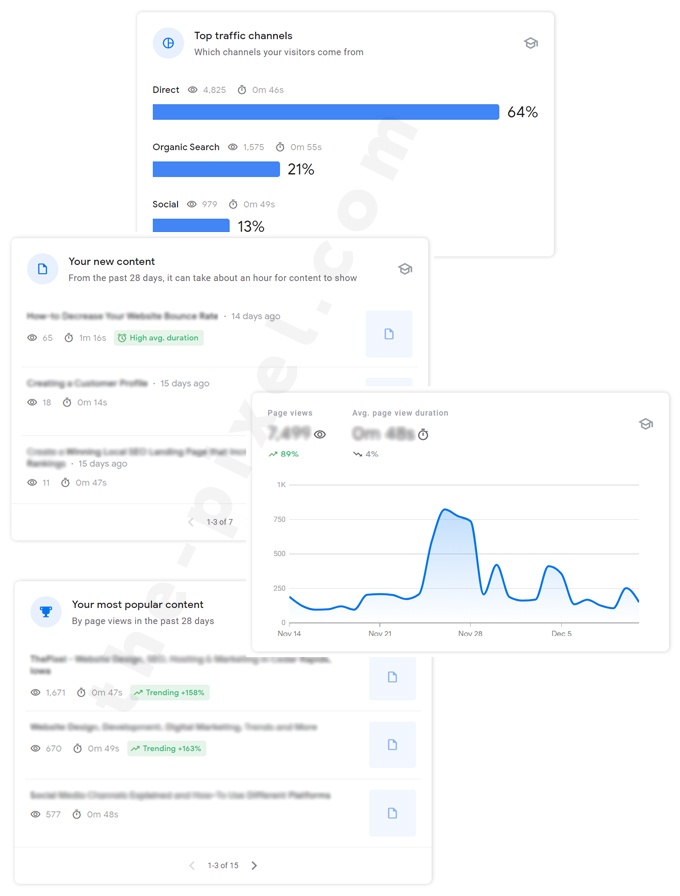
Google Analytics 4 can help identify these navigation patterns through pageview data, path exploration, and configured event tracking.
Imagine discovering that visitors frequently move between your homepage and services overview without selecting an individual service.
Does that mean the navigation is broken?
Not necessarily.
Visitors might be comparing services, looking for information that isn’t immediately visible, or struggling to understand which option meets their needs.
This is where analytics and UX research work together.
Reviewing navigation patterns alongside usability testing, customer feedback, and interaction data can help identify whether visitors are encountering unnecessary obstacles.
Sometimes improvements involve restructuring navigation or reorganizing content. Other times, clearer link labels, stronger visual hierarchy, or more recognizable calls to action can improve the experience.
The goal isn’t to make visitors follow a predetermined journey. It’s to help them find what they need without unnecessary effort.
3. Google Search Console Tells Another Part of the Story
Google Analytics helps explain what happens after someone visits your website. Google Search Console provides insight into how people discover your website through Google Search.
Together, these tools help connect search visibility with website engagement.
For example, imagine your website appears in Google Search thousands of times for a particular service, but relatively few people click through.
That raises an interesting question: Are people finding what they’re looking for in the search results?
Search Console provides several useful measurements:
- Search queries: What people searched for when your website appeared in the results.
- Impressions: How often your website appeared in Google Search.
- Clicks: How often searchers selected your website.
- Click-through rate: The percentage of impressions that generated clicks.
- Average position: Your website’s average ranking position across the measured search appearances.
These measurements can help identify opportunities to improve page titles, search descriptions, content relevance, and keyword targeting.
High search impressions don’t always translate into meaningful website traffic. If your website is appearing in search results but struggling to attract relevant visitors, explore the common warning signs in our guide, Signs Your SEO Strategy Isn’t Working.
They can also reveal unexpected opportunities.
For example, a blog article might attract visitors searching for a service your business already provides. That information could support better internal linking, additional service content, or improvements to the website’s information architecture.
Search data can help businesses understand what people are looking for before they arrive, while UX analysis helps evaluate the experience after they get there.
Effective SEO helps customers discover your website. Effective UX helps them accomplish what brought them there.
4. The Button Got Clicked. Did Anything Happen?
Imagine reviewing your website analytics and discovering that 150 visitors clicked your Contact button last month.
Sounds promising.
But what if only five people submitted the contact form?
That difference raises questions about what happens between clicking the button and completing an inquiry.
Perhaps the form asks for too much information. Maybe visitors encounter unclear instructions, unexpected requirements, or technical problems.
Or perhaps some visitors simply aren’t ready to contact your business.
Rather than guessing, businesses can use event tracking to measure important interactions throughout the process.
For example, tracking contact button clicks, form starts, and successful submissions can help identify where visitors continue and where they leave.
This is also where UI and UX design become especially important.
UI design improvements might include clearer field labels, better button visibility, stronger visual hierarchy, and more useful validation messages.
UX improvements might involve simplifying the form, reducing unnecessary steps, or ensuring visitors have enough information to make a confident decision.
The distinction matters because not every conversion problem requires the same solution.
Changing a button color won’t necessarily solve a confusing form. Likewise, rebuilding an entire page may be unnecessary when clearer instructions would address the problem.
A button click shows interest in taking an action. A completed inquiry shows that the visitor followed through. Measuring both helps businesses understand where improvements may be needed.
5. Website Analytics Reality Check
It’s easy to celebrate increasing traffic or become concerned when engagement declines.
But before making changes, it’s worth asking what those measurements actually mean for your business.
| What the numbers say | What you should investigate |
|---|---|
| “We had 2,000 visitors!” | Did visitors take actions that support your business goals? |
| “Our blog gets lots of traffic!” | Are readers finding useful information and relevant services? |
| “People click Contact!” | Are visitors successfully completing the inquiry process? |
| “Our homepage has a high exit rate!” | Did visitors find what they needed, or encounter a problem? |
| “We’re ranking on Google!” | Are we appearing for searches relevant to our services? |
| “Our engagement rate dropped!” | Did the traffic source, audience, content, or tracking change? |
A high bounce rate doesn’t automatically mean your website is performing poorly. Visitors may find exactly what they need without exploring additional pages. However, when bounce rates are combined with low engagement or declining conversions, they may reveal opportunities to improve content, navigation, or usability.
For practical ways to evaluate and improve visitor engagement, explore our guide on How to Decrease Your Website Bounce Rate.
A declining metric doesn’t automatically indicate a problem. Seasonal demand, changes in traffic sources, audience behavior, and measurement configurations can all influence website analytics.
The important thing is to evaluate performance in context rather than reacting to individual numbers.
For businesses looking to better understand which metrics to monitor, our guide on How to Track Your Website Performance and Key Analytics explains how to measure website activity and evaluate key performance indicators.
6. Turn Website Data Into Better Decisions
Collecting website data is only the beginning. The real opportunity comes from using that information to guide improvements.
Consider three examples:
A contact form receives clicks but few submissions. Reviewing form interactions, usability, and technical performance may reveal opportunities to simplify the experience.
A service page receives increasing search impressions but limited traffic. Reviewing search intent, page titles, and content relevance may help identify ways to improve visibility and attract more qualified visitors.
A popular blog article attracts visitors but generates little service engagement. Evaluating content relevance, internal linking, and calls to action may help determine whether readers have a clear next step.
Each example begins with a measurement, but the next step is investigation rather than an immediate design change.
Sometimes improvements are relatively small: clearer terminology, better content organization, more recognizable buttons, or simplified interactions.
Other findings may indicate larger opportunities involving website architecture, content strategy, or the overall customer journey.
At ThePixel, we connect website analytics, SEO performance, UI design, and UX research to help businesses understand what’s working and identify where improvements can make a meaningful difference.
This approach supports ongoing website optimization rather than relying on assumptions or redesigning simply for the sake of change.
Your Website Numbers Are Only the Beginning
Website analytics isn’t about chasing higher numbers every month. It’s about understanding how your website supports your customers and business goals.
More traffic can create opportunities, but meaningful results depend on what happens after visitors arrive.
The next time you review your website performance, look beyond the pageviews. Consider what visitors are doing, what might be preventing them from moving forward, and which improvements are worth investigating.
Because the most valuable website metric isn’t always the biggest number. It’s the one that helps you make a better decision.
Turn Website Insights Into Meaningful Improvements
Understanding your website analytics is an important first step. Knowing what to improve next is where a more comprehensive website analysis can make a difference.
At ThePixel, we evaluate website performance by connecting Google Analytics, Google Search Console, user experience, content structure, and conversion opportunities. Our goal is to help businesses understand what’s working, identify areas for improvement, and prioritize changes that support their customers and business goals.
Explore our Website Analysis Services to learn how we can help turn website data into actionable improvements.